Table Of Contents
An overview of ARS
Database construction
Search single or multiple libraries
Search single or multiple genes
Search genes in selected libraries
Search genes in selected projects
Filter
IGV visualization
Data collection
Data analysis
Data analysis
References
Contact us
An overview of ARS
Welcome to Arabidopsis RNA-Seq Database(ARS), an online database for exploring 20,000+ published Arabidopsis RNA-Seq libraries. ARS is available at http://http://plantrnadb.com//athrna/(Return to Homepage)
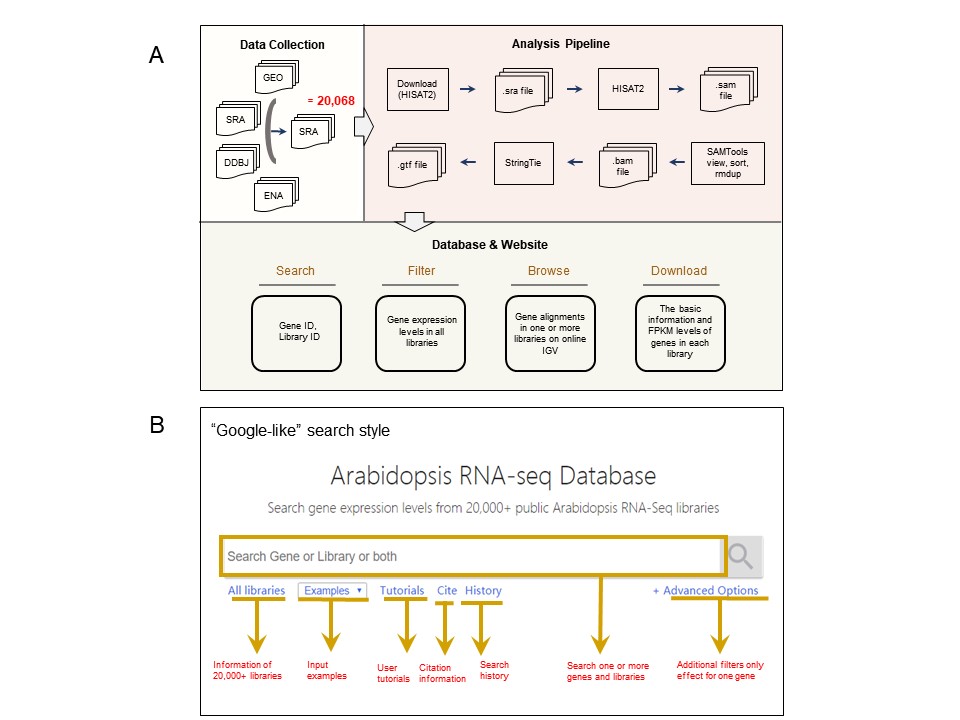
ARS is a free, web-accessible, and user-friendly database, contributes to searching, filtering, visualizing, browsing, and downloading the RNA-seq data, is described in Figure 1A. ARS functions are described as follows:
● ARS collected more than 20,000 RNA-Seq libraries. ● ARS use a standardized pipeline to calculated the expression level of each gene in each library. ● ARS can search the input gene ID and library ID, and return the basic description and expression levels. ● ARS supports to download and share the search results. ● ARS supports the coexpression pre-analysis, and provides a table of genes whose expression patterns are related to the queried gene. ● ARS also has a built-in IGV-web interface.
Database construction
ARS contributes to search, visualize, browse, and download gene FPKM data, as Figure1A described. ARS operates flexible that supports a "Google-like" search through querying of genes and libraries (Figure 1B), and returns the fundamental description, exhibit and visualize expression levels, and support IGV-web (https://igvteam.github.io/igv-webapp/) interfaced genomic alignment. We show the overflow in Figure2.
Search single or multiple libraries
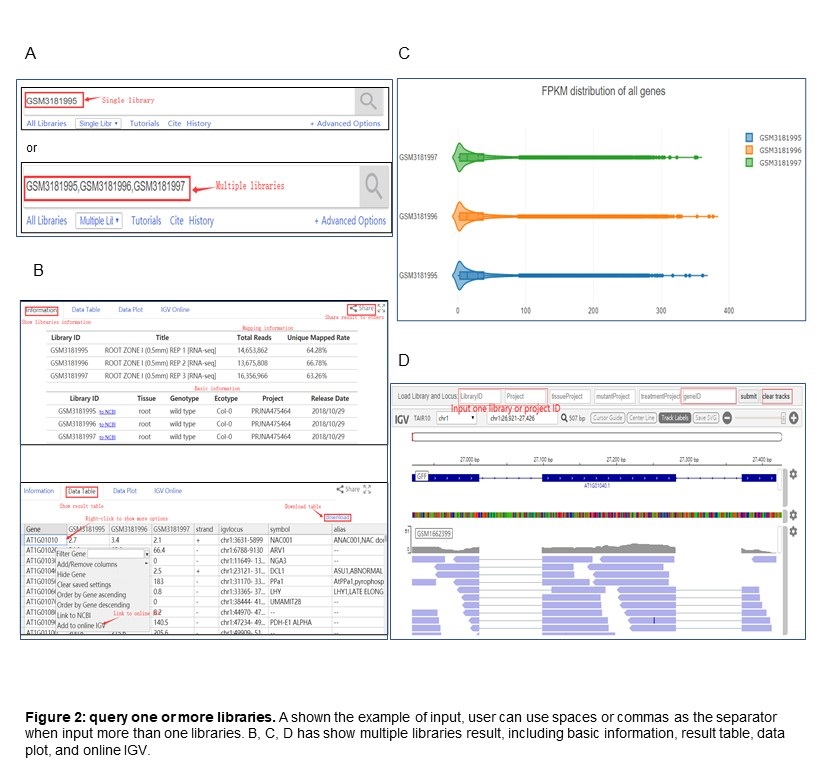
ARS supports the search for one or more libraries, also support search for a keyword to get libraries. The input is one or more libraries ID separated by commas or spaces. All genes FPKM will be shown (see Figure 2) after the user submitted the library ID. By the way, gene and library ID can be queried together, and Figure 2B has demonstrated the result.
Search single or multiple gene
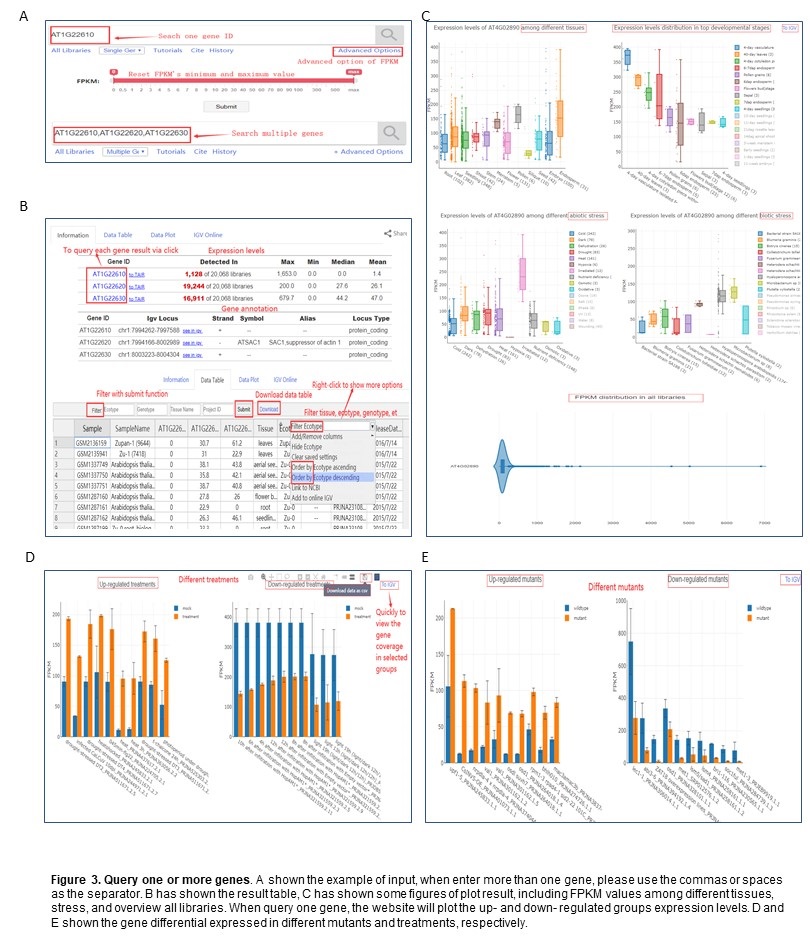
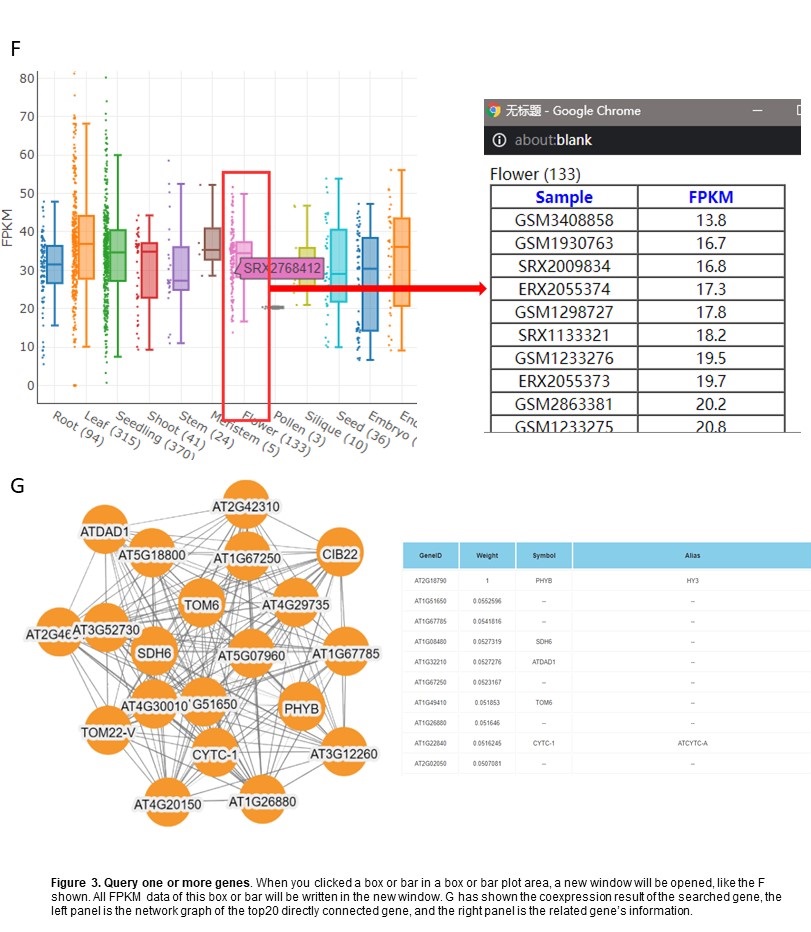
ARS allows searching one or more of all 37,336 genes annotated in Araport11 database (Figure 3A). For visualization result, bar and box plots describe the global FPKM levels (Figure 3C). When only one gene has been searched, the advanced option will be valid to specify the stress, tissue and the maximum and minimum values of FPKM in the table. The "Data Plot" page will describe the highest ten dataset FPKM value in tissue, and the user can choose more tissue to draw by clicking the legend on the right. At the same time, the page also displayed the higher expression levels groups of treatment conditions and mutants, which have a higher fold change of up-regulated and down-regulated, respectively. When queried more than one gene, the user can view the gene's detail information via click the gene name on the information table. At the some time, we also figure the expression levels among different tissues for each gene (Figure 3C, 3D, 3E). In the box and bar plot in the "Data Plot" page, each box and bar are working when you click the box/bar, and a new window will be opened which written with the detailed data in the box/bar, like the Figure 3F. The coexpression analysis also only works for the single gene and the top19 directly connected gene will be shown as one network graph and a table (see 3G).
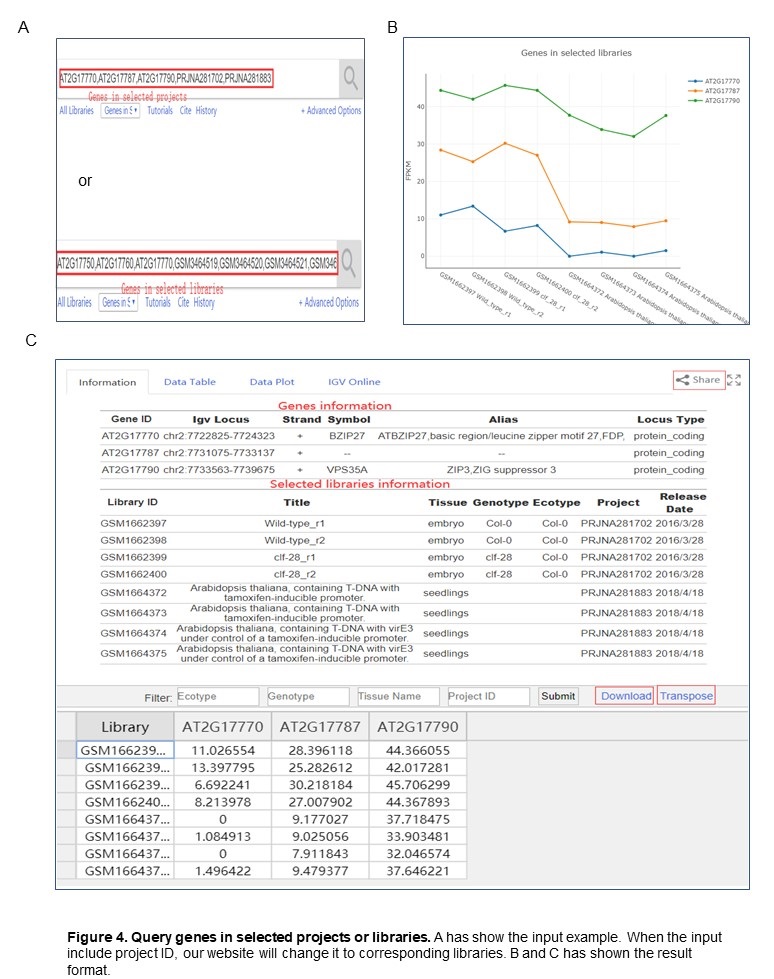
Search genes in selected libraries
In ARS, user can enter one or more genes with specify libraries, and that command must be separated by commas or spaces. Figure 4 has show the input example and result.
Search genes in selected projects
Our database also supports searching for the expression of single or multiple genes in a given project list. The input need to be separated by commas or spaces. Its result format is consistent with "Search genes in selected libraries", as shown in the Figure 4.
Filter
In the data table result, user can right-click to show advanced options for each column, such as hide, remove, order-by, filter. We also support user to filter with the submit button. For the filter option, the user can select which options to view by selecting that from their respective drop-down boxes (Figure 3B).
IGV visualization
ARS integrates an online IGV interface to browse and compare the genome matched RNA-Seq in one library or project. The links of online IGV interface are added into the results of each type of query. If user wants to clear all current tracks, please clicking the "clear tracks" button. Also, the IGV online can add multiple libraries or projects convenient for comparison(Figure 2D).
Data collection
We collected Arabidopsis RNA-Seq datasets published till March, 2019 from GEO, DDBJ, EBI, and SRA database using keywords — ”((Arabidopsis thaliana[Organism]) AND "transcriptomic"[Source]) AND "rna seq"[Strategy]”. After the search, we checked the detail information, and then removed pseudo libraries which are small RNA-Seq or ncRNA-Seq.
Data analysis
Because the HISat2 supports access SRA database and can use the .sra format as input, we don't need to download raw data and convert the .sra to fastq format extra. (Because of the internet limit, some local server can't support that function, at that time, you must use wget or other software to download raw data.) We calculated all genes expression value (FPKM) with Stringtie and collected them. The flowchart of the data collection, processing, and database functions are illustrated in Figure 1.
References
Kim, D., Langmead, B., and Salzberg, S.L. (2015). HISAT: a fast spliced aligner with low memory requirements. Nat Methods 12, 357-360. Pertea, M., Pertea, G.M., Antonescu, C.M., et al. (2015). StringTie enables improved reconstruction of a transcriptome from RNA-seq reads. Nat Biotechnol 33, 290-295. Robinson, J.T., Thorvaldsdottir, H., Wenger, A.M., et al. (2017). Variant Review with the Integrative Genomics Viewer. Cancer Res 77, e31-e34. Sievert, C., Parmer, C., Hocking, T., et al.(2016). plotly: Create interactive web graphics via Plotly’s JavaScript graphing library [Software]. Franz M, Lopes C T, Huck G, et al. Cytoscape. js: a graph theory library for visualisation and analysis[J]. Bioinformatics, 2016, 32(2): 309-311.
Contact us
Dear the ARS users, Thank you for using the ARS database! If you encounter any problem or have any question, please don't hesitate to contact us at zhaijx@sustech.edu.cn or zhangh9@mail.sustech.edu.cn. Best wishes, ARS Team